In this page, the impact on land use classification type on simulations is discussed. A pair of simulation was carried out as below,
Forcing data: GPCC
Time perid: 1979-2004
Land use type: GSWP2 (International Geosphere-Biosphere Programme -based) and GSWP-3 (HYDE -based)
Spatial resolution: 1o x 1o
Land Cover Classification:
Following are the global distribution of land cover type from two datasets.
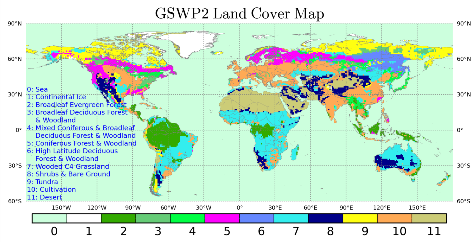 Fig. 1A: Global distribution of land cover from GSWP-2 based on IGBP. |
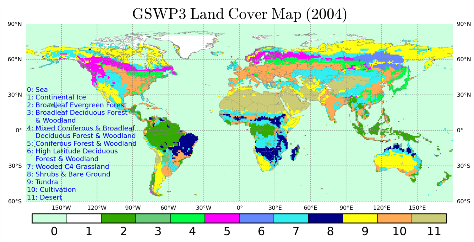 Fig. 1B: Global distribution of land cover from GSWP-3 based on HYDE. |
The HYDE based database comprises of annual time series of land cover type. Here, the land cover distribution of GSWP-3 for year 2004 is presented. In fact, the major change in land cover type over the study period is in secondary vegetation (usually to cultivation) but the change is not significant enough to change the secondary vegetation into a primary one (with area >50% within a grid cell). Hence, the land cover distribution from HYDE for 2004 is same as that for 1979. The classification might change if finer spatial resolution is considered. Also, it is imperative that model with mosaic (sub-grid variability of land cover type) is used if the objective is to examine the effect of land use change on hydrology.
The difference can be seen in:
- Regions to the east of Amazon river basin (Tocantins river basin) where major land use is Wooded C4 Grassland (7) in GSWP2 but it is classified as Shrubs and Bare Ground in GSWP3 (8).
- Australia: Shrubs and Bare Ground (8) in GSWP2 is classified as Tundra (9) in GSWP3 (??).
- West coast of US: Shrubs and Bare Ground (8) in GSWP2 is classified as Tundra (9) and Wooded C4 Grassland (7) in GSWP3.
- China: Cultivation (10) in GSWP2 is classified as Shrubs and Bare Ground (8) and Mixed Coniferous and Broadleaf Deciduous Forest and Woodland (4) in GSWP3.
Further, same LAI maps are used for both simulation. The global distribution of LAI is as follows,
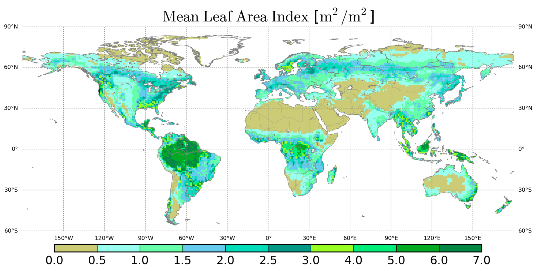 Fig. 2: Global distribution of leaf area index (LAI) |
Since, the land cover type has changed in many regions as discussed above, it is necessary to update LAI map as well (??).
Land type properties:
The properties of different land cover type are as shown in the following Table.
Table 1: Properties for different types of land cover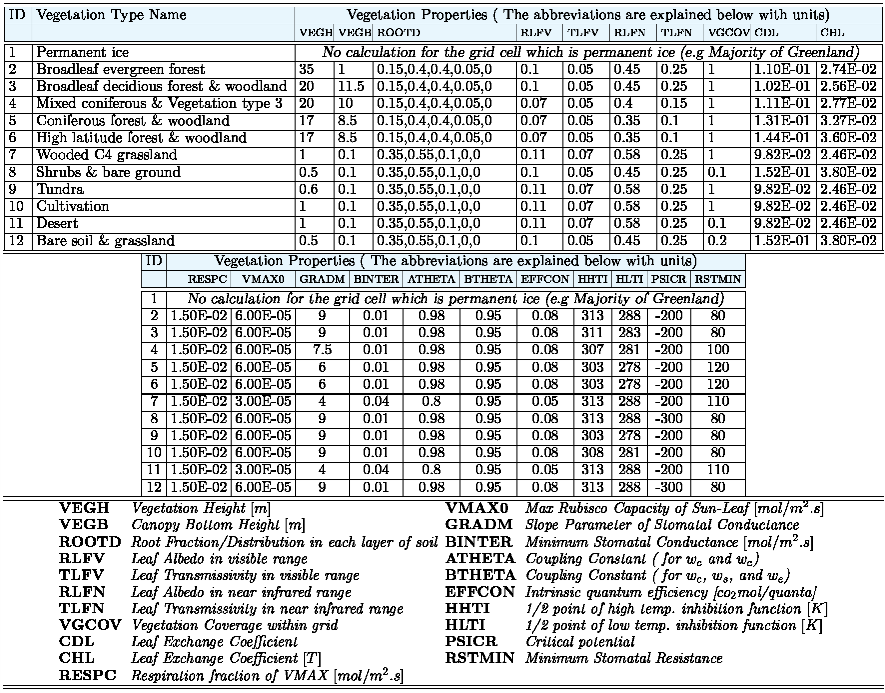 |
Annual time series:
Here, the difference in annual variability of major hydrological fluxes due to different land cover type are discussed.
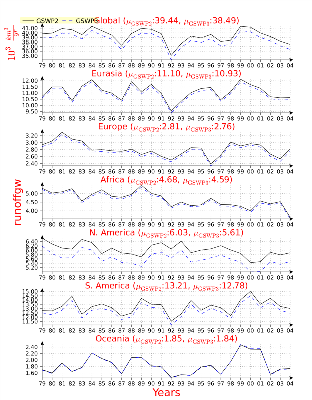 Fig. 3A: Total runoff |
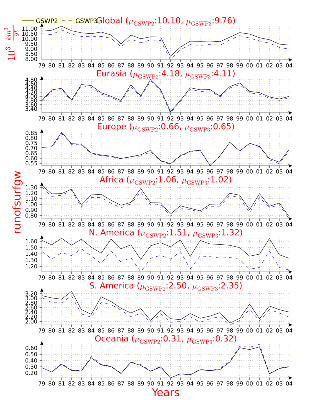 Fig. 3B: Surface runoff |
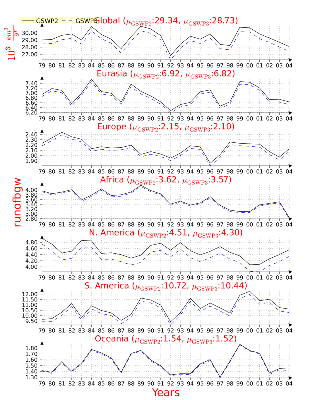 Fig. 3C: Base runoff |
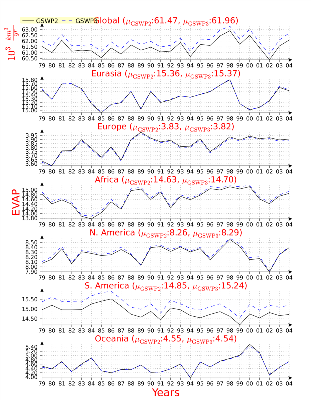 Fig. 3D: Total evapotranspiration |
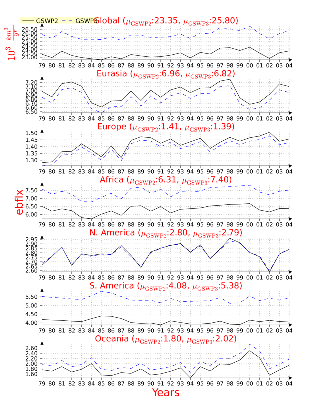 Fig. 3E: Soil evaporation |
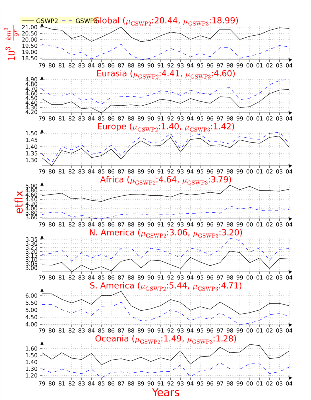 Fig. 3F: Transpiration |
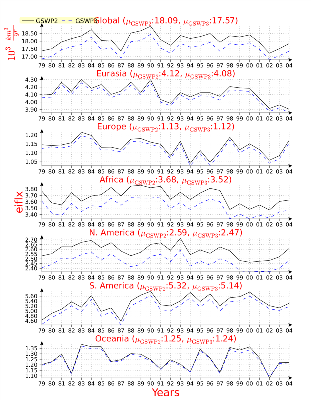 Fig. 3G: Canopy evaporation |
- The GSWP3 runoff is lower than GSWP2 by around 1000 km3/yr (Fig. 3A). This is due to larger ET in GSWP3. Both surface runoff and base runoff are lower by similar proportions in GSWP3.
- North and South Americas, and Africa show the largest increase in ET due to lower vegetation cover.
- Component wise, most of the increase in bare soil evaporation in GSWP3 is compensated by decrease in transpiration.
- The canopy evaporation is much lower for GSWP3 in Africa and N. America due to difference in vegetation height (VEGH, VEGB in Table 1) (??)
Global distribution of difference:
Here the global distribution of the difference caused by different land cover classification is presented. The difference is in mm/year.
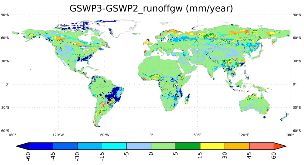 Fig. 4A: Total runoff |
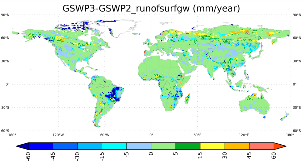 Fig. 4B: Surface runoff |
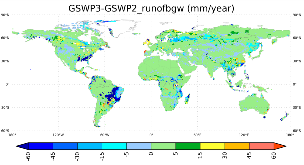 Fig. 4C: Base runoff |
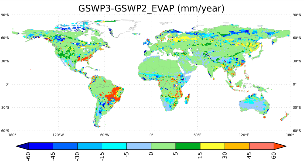 Fig. 4D: Total evapotranspiration |
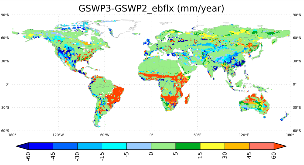 Fig. 4E: Soil evaporation |
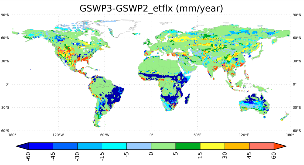 Fig. 4F: Transpiration |
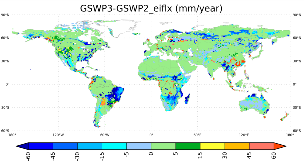 Fig. 4G: Canopy evaporation |
- Most of the difference in simulation is contributed by regions in east of Amazon and Sahel regions of Africa. GSWP3 runoff is lower than GSWP2 runoff in these regions.
- The larger soil evaporation for GSWP3 in these regions cannot be compensated by smaller transpiration and canopy interception in these regions.
- The increase in soil evaporation in Australia seems to be compensated by decrease in transpiration.